13
Mar
FIU RCMI GIS Intermediate Workshop – Exercise 1
Comments
Exercise #1 – Exploring Basic GIS Concepts in ArcGIS Pro
Objective: Learn how to load spatial data, calculate new fields and apply classifications to visualize data.
The exercise includes a few fundamental concepts that we have just covered. First, you will download data from Miami-Dade County’s Open Data Hub containing boundaries of US Census Tracts with corresponding Census socio-demographic variables, and use this data source to explore the basic functionality of ArcGIS Pro. Feel free to follow the steps below, or follow along live in the workshop.
Step 1 – Download data
- Download US Census Tract Data from Miami-Dade County’s Open Data Hub at https://gis-mdc.opendata.arcgis.com/. This Open Data repository houses several useful datasets that were either generated or aggregated by the county.
- Use the Search Function to find the Tract 2020 dataset. You can also use the following direct link.
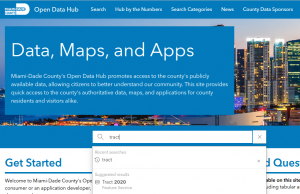
- Click the Download button on the dataset’s page and select Shapefile as the format.
- Once downloaded click the i (information circle) to navigate back, and select the View Full Details option to learn more about the dataset.
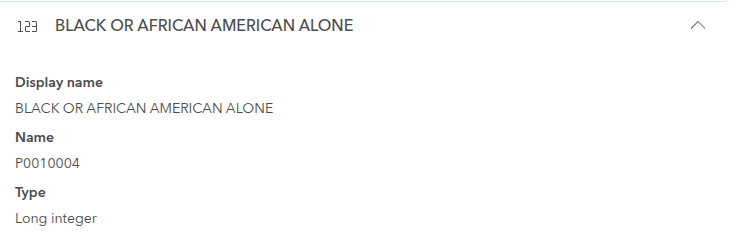
- Under Attributes, you can explore the available attributes (columns, variables) included in the dataset for each Census Tract. Note that while attribute names appear to be descriptive (e.g. Population Count 100%, or White alone), these descriptions will not appear in the downloaded shapefile due to technological constraint of the data format. You can open each attribute to check the corresponding variable name of each variable as shown below for the number of Black/African American population, which will be coded in the P0010004 field.
- Remember, that shapefiles actually consist of multiple files of the same name, but with different extensions. For download, all these files come compressed into a .zip file, that need to be extracted before it can be added to ArcGIS Pro.
- To do this, find and select the downloaded file (named Tract_gdb_-xxxxxxxxxxxxxxxxxxxxx.zip or similar) in your preferred File Manager, then Right click -> Extract all. This will extract the files into a folder.
Step 2 – Add data to ArcGIS Pro
- Open ArcGIS Pro and start a new project named Exercise_1
- Once an empty project opens, add the downloaded shapefile to the project.
- You can either drag and drop the Tract.shp file from your file system, or
- Use the Map menu in the Ribbon on the top of the window, and click the Add Data button and browse your downloaded file.
Step 3 – Calculate new fields
- In Step 1, we confirmed that the field P0010004 refers to the number of Black/African American population living within the census Tract. We can express this as a percentage in relation to the total population in that tract.
- Open the Attribute Table by selecting the Tract layer in the TOC, then Right click -> Attribute table. This will open a dockable window with the attributes associated with the layer.
- In the Attribute table window, click Add+ and scroll down to the end of the list. In the last row (should be empty), name the new field as pct_black, and set the Data Type to Float.
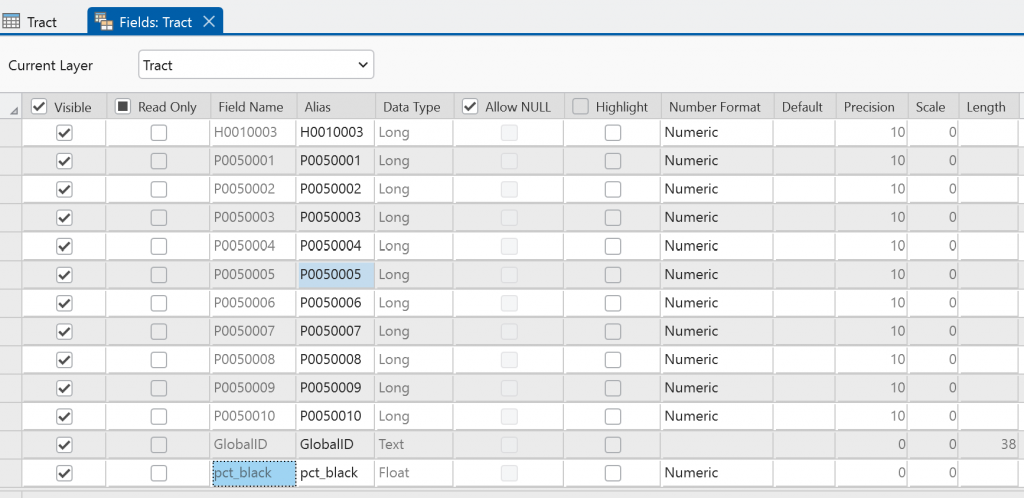
- Click Save in the top Menu (ribbon) of the ArcGIS Pro window to create the new field. (The Fields contextual menu should be active at this point)
- Navigate back to the Tract attribute table, scroll all the way to the right to see the newly created pct_black field. Right click on the header pct_black, then select Calculate Field.
- Make sure to calculate the new pct_black field, and set the expression to !P0010004! / !POP100! * 100, then click Apply.
- The percentage of Black/Africa American population is now calculated as a new attribute field, and you can close the Attribute Table.
Step 4 – Adjust symbology
- Right click the Tract layer in the TOC, then select Symbology.
- Explore different ways to create Thematic maps using the newly calculated pct_black attribute and others.
- The Unclassed Colors option will fill the tract with a color gradient.
- Explore different Methods of creating classes with the Graduated Colors option.
- Use the Dot Density option and one of the original attribute fields to create dot density maps of the population