13
Mar
FIU RCMI GIS Intermediate Workshop – Exercise 3
in News
Comments
Exercise #3 -Analyzing point patterns in ArcGIS Pro
Objective: Learn how to aggregate point data in polygons, calculate spatial statistics (Global Moran’s I and General G), and interpret spatial patterns in public health data
This exercise illustrates how to count points within polygons, then uses these aggregated count values to calculate commonly use spatial statistic measures (Global Moran’s I and Getis-Ord General G statistic).
Step 1 – Load data
- Open ArcGIS Pro and create a new project called exercise_3.
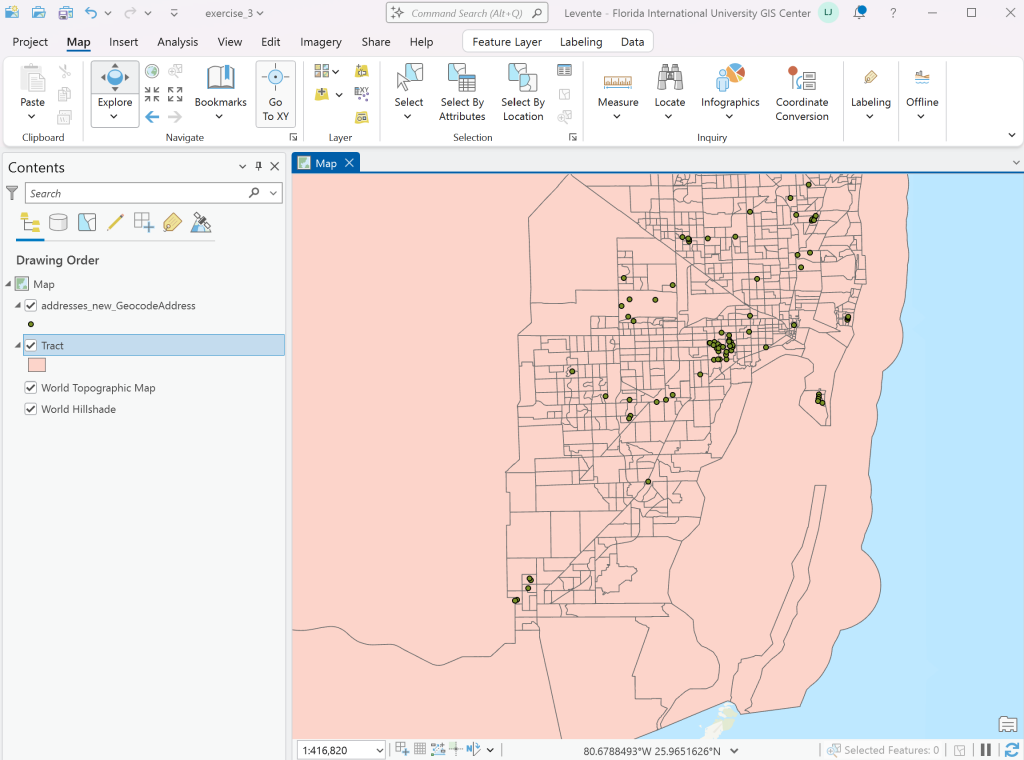
- Load the Tract dataset, and the geocoded address dataset (Hint: if you did not save it specifically, it should be in the exercise_2 project’s geodatabase. Your ArcGIS window should look similar to the one shown below.
- There are multiple ways to count how many points fall within each Census Tract. Below, we will use the Summarize Within tool, but we could also perform a Spatial Join to relate the geometries of address points to Tracts.
- In the Analysis Menu, click Tools to open the Geoprocessing window.
- Find the Summarize Within tool
- Set the Input to the Tracts layer, and the Input Summary Features to the geocoded addresses layer. Make sure to check the Keep all input polygons and the Add shape summary attributes checkboxes. The tool will create a new column names Count of Points
- Change the Symbology of the new layer (Right click -> Symbology) to Graduated Colors and color it based on the point count field
- You can also check descriptive statistics of this field. Open the Attribute Table, then right click on the header of the Count of Points field, then select Explore Statistics
- What is the mean of point counts?
Step 2 – Calculate Global Moran’s I statistic
- Find the Spatial Autocorrelation (Global Moran’s I) tool
- Set the Input Feature Class to the one that contains the point counts. Set the Input Field to ‘Count of Points’.
- The Conceptualization of Spatial Relationships option controls our definition of the neighborhood.
- Select the Contiguity edges corners option, which only considers neighbors if the polygons share boundary of corner points
- Set Standardization to Row
- Make sure to check the Generate Report checkbox and Run the tool.
- Open the Report (a HTML file) and check the statistic
- What kind of pattern did we detect?
Step 3 – Calculate the General G function
- Find the High/Low Clustering (Getis-Ord General G) tool
- Set the Input Feature Class to the one that contains the point counts. Set the Input Field to ‘Count of Points’.
- The Conceptualization of Spatial Relationships option controls our definition of the neighborhood.
- Select the Contiguity edges corners option, which only considers neighbors if the polygons share boundary of corner points
- Set Standardization to Row
- Make sure to check the Generate Report checkbox and Run the tool.
- Open the Report (a HTML file) and check the statistic
- What kind of pattern did we detect?